They have done a similar thing with their built-in Calculator. A Graphing feature, which initially was enrolled in an insider preview and later became generally available for all, provides a clean and interactive experience to allow people to visualize equations and help them learn more about subjects like linear Algebra.
How to use Graphing Calculator in Windows 11/10
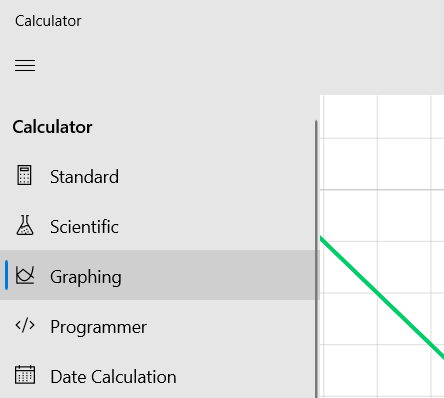
To open the calculator, you simply have to search for the word ‘Calculator’ in the start menu search box and open the first app that shows up. By default, you will first view the standard calculator used for math problems we face in our daily life. Click on the menu from the top-left corner of the screen and select ‘Graphing.’
You will then see a two-dimensional plotting surface where you can input equations and find out what their resultant graphs look like. The option to input an equation is at the top-right corner of the calculator window.
As you can see from the picture above, you can compute both linear and quadratic equations in the calculator. This calculator allows you to plot multiple equations on a single graph, which can help in linear programming. All the equations are color-coded, so it is easy to distinguish them from one another.
Next to each equation are three options; the first one, Analyze, gives you the characteristic properties of the expressions, like their maxima, minima, domain, inflection points, etc. Read: How to use Windows Calculator to perform Date Calculations. The second option allows you to customize how an equation is depicted on the graph. In cases where you want to compare two equations, you might want one to them to be a striped or dotted line/curve. This can help you do that. You can also change the color of the equation using this option. The last one is to discard an equation from the graph.
Mathematics on this graph isn’t limited to algebraic expressions. You can also plot graphs for trigonometric equations (equations that use sine, cosine, and tan, etc.), establish graphs for linear and quadratic inequalities, and even plot graphs for various kinds of functions like modulus, absolute values, and the greatest integer function. Among the maze of buttons that are used to input numbers and variables is also Euler’s number ‘e’ and also the natural log (ln) function, so you can make graphs for exponential and logarithmic equations too. The natural log button is among the first group of buttons that show, but if you want to graph ‘e’ functions, you will get access to it by pressing the ‘2nd’ button, which opens the second group of available buttons on the calculator.
One of the most interactive features I found in the graphing calculator was the real-time analysis of a multivariable relation. Users can plot equations that involve a variable very easily on this graphing calculator by simply typing out the expression of the equation in the empty box. Suppose you input an equation like y=mx+c (slope of a line). The result would be a straight line with an option for you to change their values while observing the change in the graph in real-time. For example, in the equation y=mx+c, you can change the value of m, which is the slope of the line, and watch the graph pivot around the y-intercept. Similarly, you can change the value of c, which is the y-intercept observe the parallel movements in the graph. I have given you a simple example here for demonstration, but it works just as well with more complex equations too.
It is also very easy to trace the coordinates on any graph drawn here. All you have to do is hover your mouse over the point of the coordinates in which you’re interested, and they will be displayed. On the graph space, to the right of the graph are the graph options. These options help you adjust the graph window, i.e., the maximum number of units on the x and y-axis. The thickness of the graph can be adjusted from here too. If you are looking to plot trigonometric relations, you can also change the units from degree to radians or gradians. You can also share graphs with the contacts synced with your Microsoft account, a feature that I believe can come in handy for people who make use of linear algebra frequently. In conclusion, I would like to say that the graphing calculator in Windows 10 is a very useful feature for people who want to learn about linear algebra or extensively use mathematical graphs for professional purposes. If you have no use for it, you can always turn off Graphing in Calculator.